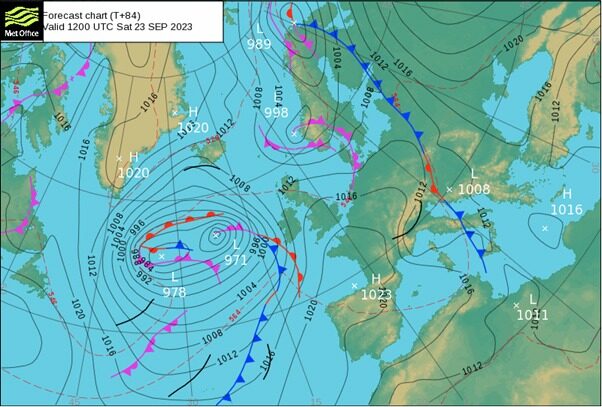
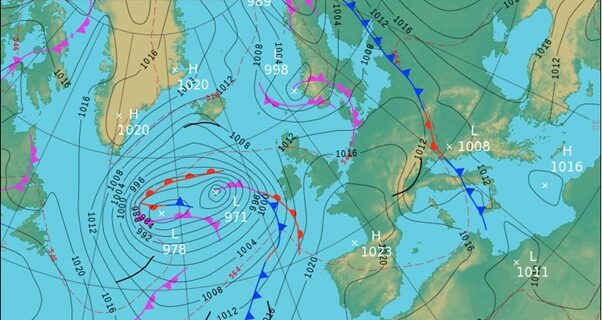
You may also notice on these charts that there are dashed lines as well. This coloured map shows them as red dashed lines and they indicate thickness lines – the vertical distance between the 1000mb and 500mb pressure levels. Warm air will be ‘thicker’ and cold air will be ‘thinner’. On the map they are shown as decametres so 5280 metres is shown as 528. We refer to this as the Snow Line. Any areas that are North of the 528 line, the precipitation is likely to fall as snow whereas for areas situated South of the 528 line, it is more likely to fall as rain.
Isobars
Now there may be some people in the world who believe the Earth is flat, but there is no doubt that the Earth’s surface is not! The air pressure decreases as altitude increases. So how is it that we can create isobars, lines of equal pressure when the Earth’s surface has all different elevations? What we do is take measurements of air pressure and convert it to a value that would be observed if that instrument was located at sea level. We use sea level as the common denominator which allows us to draw equal lines of pressure and create isobars.
What Weather Conditions can we expect in High and Low Pressure?
Typically, weather conditions in high pressure are more settled, sunnier, drier with less wind. This is because air is sinking. In low pressure, warm air is rising which then condenses to form clouds and precipitation. Therefore in general, you will get cloudier, wetter and windier conditions in low pressure.